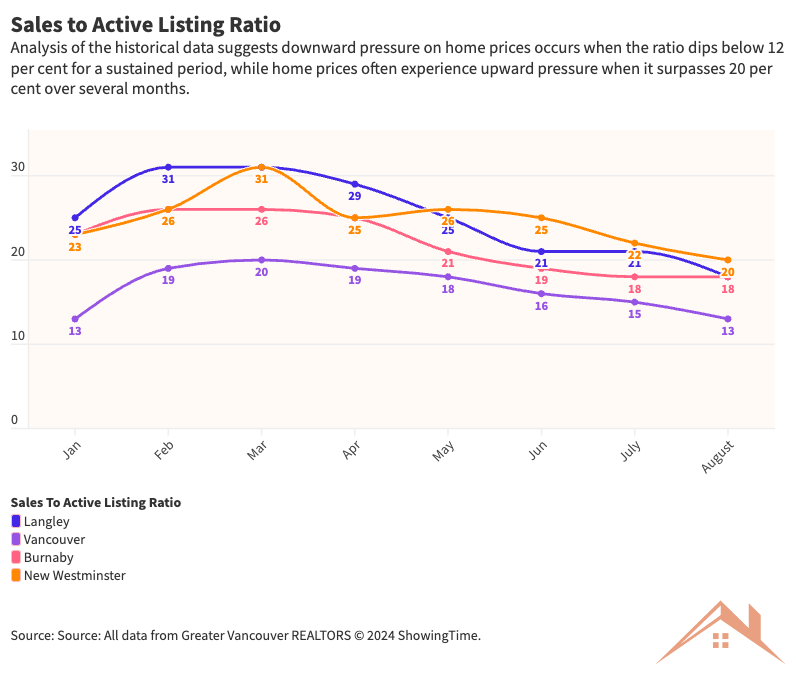
Decoding the Sales-to-Active Listing Ratio
Analysis of the historical data suggests downward pressure on home prices occurs when the ratio dips below 12 per cent for a sustained period, while home prices often experience upward pressure when it surpasses 20 per cent over several months.
The chart shows how many homes were sold compared to the total number of homes available for sale in different areas from January to August 2024.
Key takeaways:
Langley has remained a seller’s market throughout the year.
Vancouver and Burnaby have seen a slight shift towards a buyer’s market in recent months.
New Westminster is showing signs of increased demand.
It would be interesting to see how next few months unfold.
What does this mean for you?
Buyers: More negotiating power in certain areas.
Sellers: Potential need to adjust pricing strategies.
Stay informed and make informed decisions!